
SawtoothTrade
Alert for lag latency
Click on each link above to download.
Put both files in your Sierra Chart \Data folder, then click on Analysis >> Lag Alert v2+
This study uses the Spreadsheet System/Alert study and will give an alert when the time difference between the bar update timestamp and your local computer clock exceeds the user-defined threshold in fractional seconds. Milliseconds are supported in v2. It is a standalone study that does not require any other studies.
To set the audible alert, go to this study's Settings >> Settings and Inputs tab >> Column O Alert...then choose an Alert#. The default is Alert1.
Note: The alert is not set on the Alerts tab.
This lag alert system only works in real time because it uses the NOW() function which captures your current local computer time. It also will not show any history of lag. It will only alert in real time when it happens.
This study works best in an active market where chart updates happen frequently. It compares the last chart update timestamp (cell J41) with the current local computer time using the NOW() function. The alert cannot be more accurate than the 'Chart Update Interval in Milliseconds' setting.
A chart update (J41) only happens when there is an uptick/downtick in price, or a change in volume or #trades, or a new bar is formed, but not when there is a change in the Bid/Bid Size nor Ask/Ask Size.
The NOW() function is updated at both a chart update and a change in the Bid/Bid Size or Ask/Ask Size (for which there is no timestamp available). This difference in time can cause an erroneous lag alert between chart updates in a slow market.
It is recommended that you use an atomic clock synchronizer for your computer clock, and set it to update frequently.
On the spreadsheet:
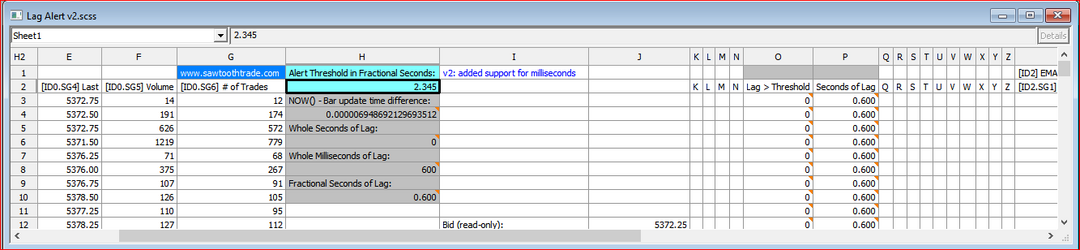
- The alert threshold in Fractional Seconds is set in cell H2.
The following cells are used for calculations; do not edit them:
- Cell H4 is the difference between your local computer clock and a chart update.
- Cell H6 is the whole Seconds of lag.
- Cell H8 is the whole Milliseconds of lag.
- Cell H10 is the Fractional Seconds of lag.
The chart background is colored when the alert is TRUE.
To disable this, set the Draw Style of SG5 to Ignore.
Optional: You can display on the chart the Fractional Seconds of Lag in column P (SG6) using the Text Display for Study study.
This spreadsheet’s formulas are built on Sheet1, which corresponds to Chart #1. If you apply this study to a different chart number, you must copy/paste the contents of cells H1-H10 on Sheet1 to cells H1-H10 on the corresponding Sheet#.
Do this:
- On Sheet1, highlight cells H1-H10.
- On the main menu, go to Spreadsheet >> Copy Formula .
- Go to the new Sheet# that matches the Chart# and highlight cells H1-H10.
- On the main menu, go to Spreadsheet >> Paste.
- You must now use H2 on the new Sheet# to set the alert threshold.