Volume at Rollover

SawtoothTrade
Fair Value Gap
Click on each link above to download.
Put both files in your Sierra Chart \Data folder.
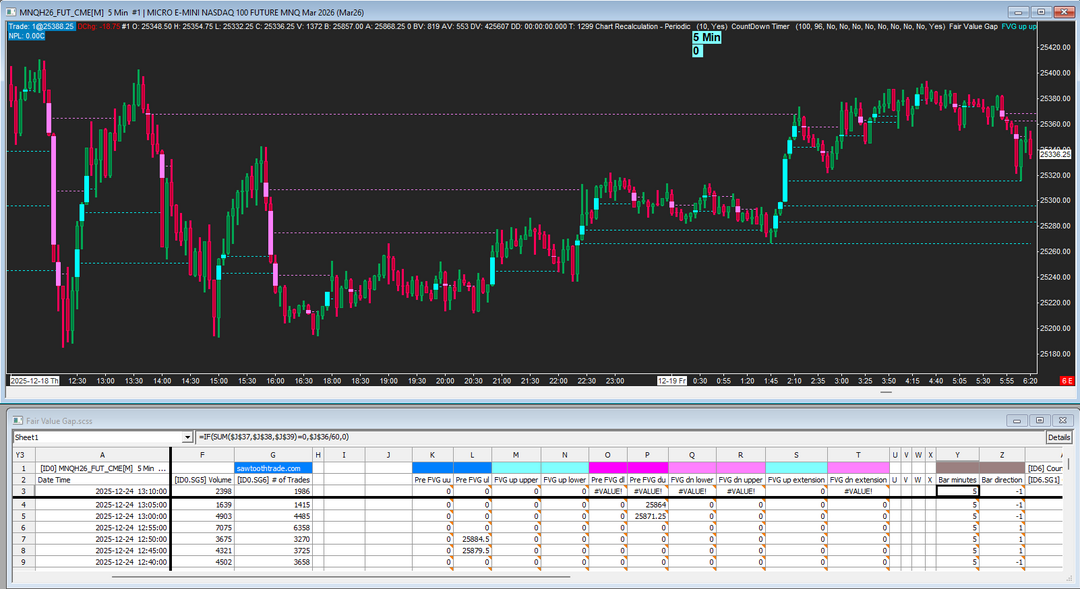
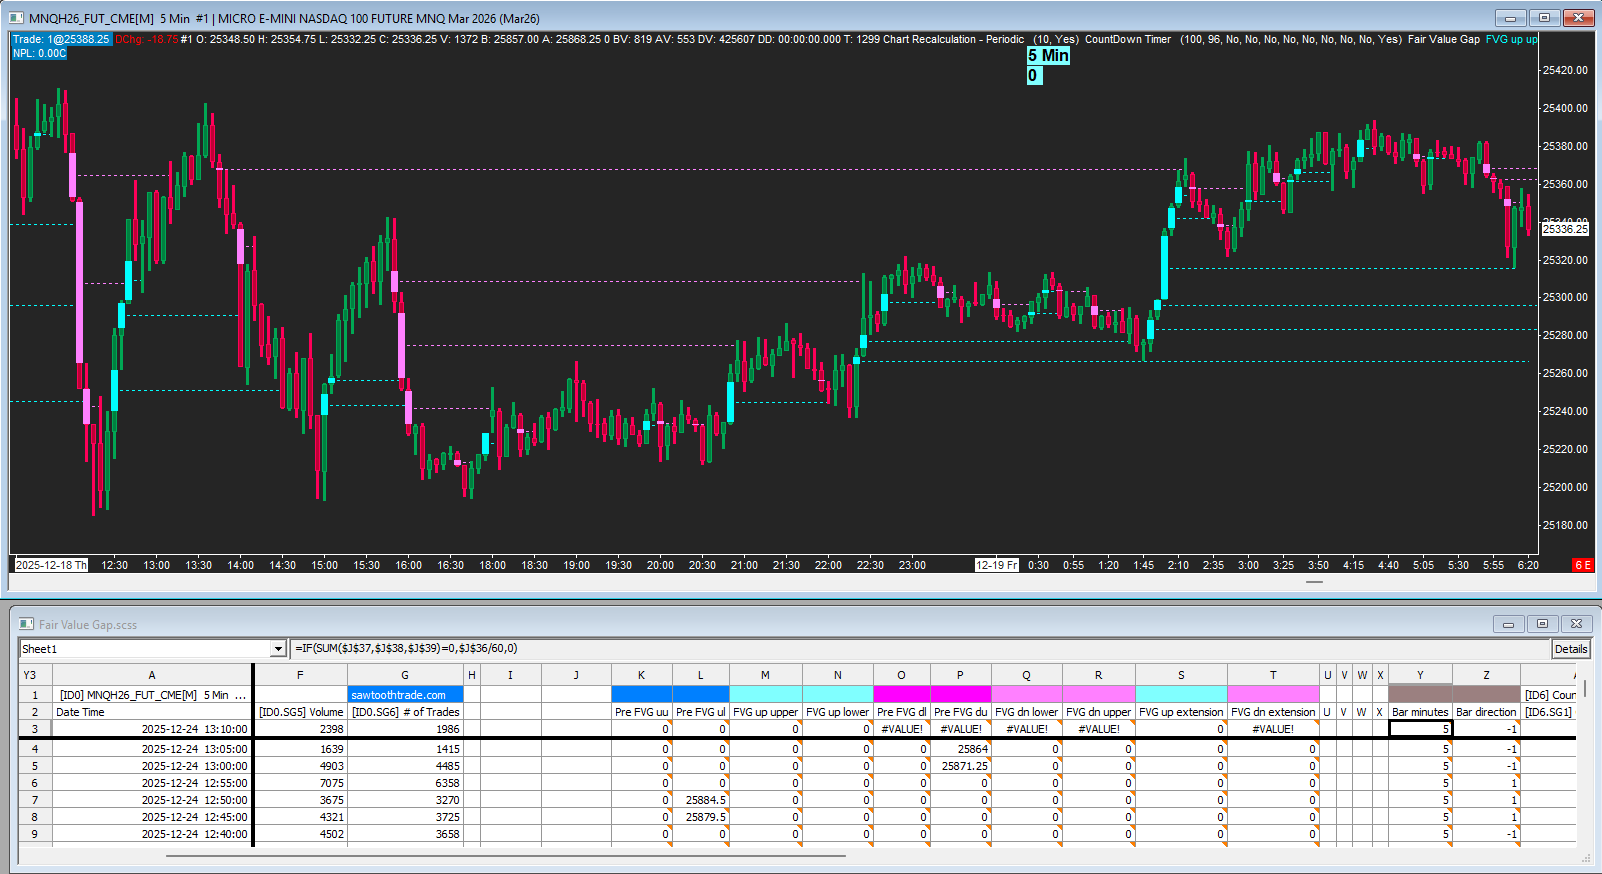
This chartbook, with its spreadsheet study, draws a rectangle on a chart bar showing the gap between the extremes of the previous bar and its subsequent bar, if one exists. These Fair Value Gaps are colored based on the bar's direction.
Two instances of the Color Bar Based On Alert Condition study are used to draw extension lines from the center of the Fair Value Gap until future intersection.
If the chart bars are time-based, the bar duration is displayed. If the chart bars are of another type, a zero is displayed. Below this display is the bar's countdown.
This works using any bar type, including Historical bars.
There are no user options on the spreadsheet sheet so you may minimize it.