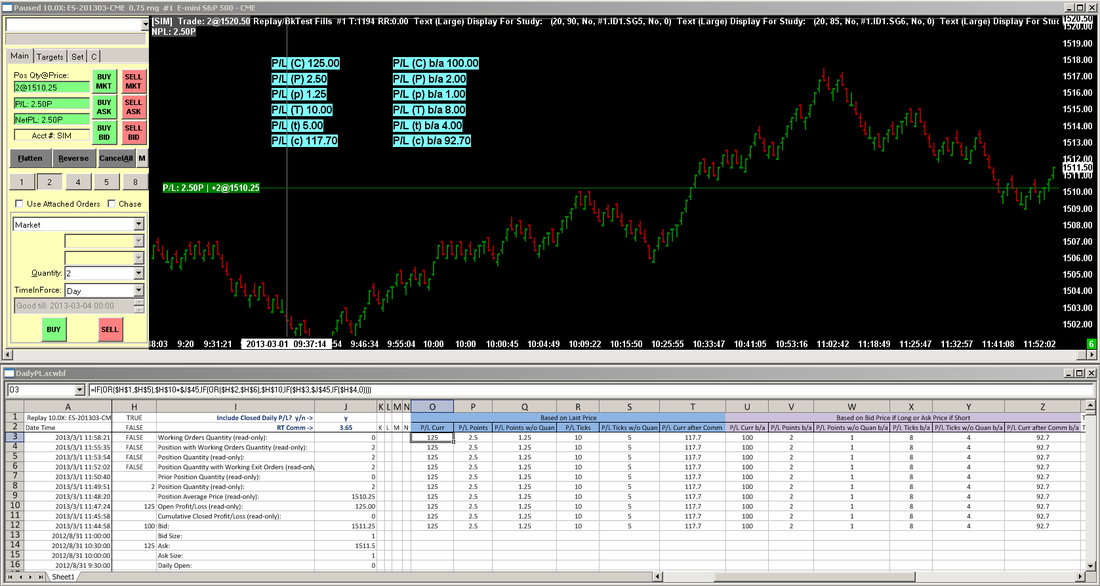
P-L based on Bid (if long) and Ask (if short)
|
This spreadsheet study is handy if you require your displayed P/L to be based on the Bid/Ask prices instead of the Last price. It also has an option to subtract commissions.
This spreadsheet study calculates 12 Profit/Loss data, 6 based on the Last price, and 6 based on the Bid (if long) and Ask (if short). These are the 12: -Currency -Points -Points – ignore quantity -Ticks -Ticks – ignore quantity -Currency – after commissions -Currency (bid/ask) -Points (bid/ask) -Points – ignore quantity (bid/ask) -Ticks (bid/ask) -Ticks – ignore quantity (bid/ask) -Currency – after commissions (bid/ask) You can option it to calculate either the Open P/L or the Open P/L + Daily Closed P/L. It does not calculate only the Daily Closed P/L. This is a standalone study that does not require any other studies for its calculations, but it is intended to be used with the Text Display for Study study, so that you can display any/all of the 12 values anywhere in the chart region. Click on each of these links to download: DailyPL+.StdyCollct DailyPL.scss and put both files in your Sierra Chart \Data folder, then click on Analysis >> DailyPL- On the spreadsheet: In cell J1, enter ‘y’ to add the Daily Closed P/L to the Open P/L, or enter ‘n’ for only the Open P/L. In cell J2, enter your round trip commissions. Please use the DailyPL-.StdyCollct file because it loads the correct spreadsheet study with the correct settings. This spreadsheet’s formulas are built on Sheet1, which corresponds to Chart #1. When using the Study Collection to apply this study to any chart# other than Chart #1, do this: 1) Go to Analysis >> DailyPL- and apply. 2) Go to Analysis >> Studies >> select DailyPL >> Setting button >> Settings and Inputs tab >> set the Formula Source Sheet Number to match the Chart #. 3) On the spreadsheet: -On Sheet1, in the upper left corner, click on the rectangle above the 1 and to the left of A, to highlight the entire sheet, then press Ctrl-C to copy. -On the sheet # that matches the chart #, in the upper left corner, click on the rectangle above the 1 and to the left of A, to highlight the entire sheet, then press Ctrl-V to paste. This spreadsheet study uses the Spreadsheet System for Trading study because it the only study that has the required outputs. To assure that it does not cause erroneous entries, autotrading has been disabled in cell J28. Furthermore, do not put any formulas in columns K,L,M,N. |

