Color Line Angle
|
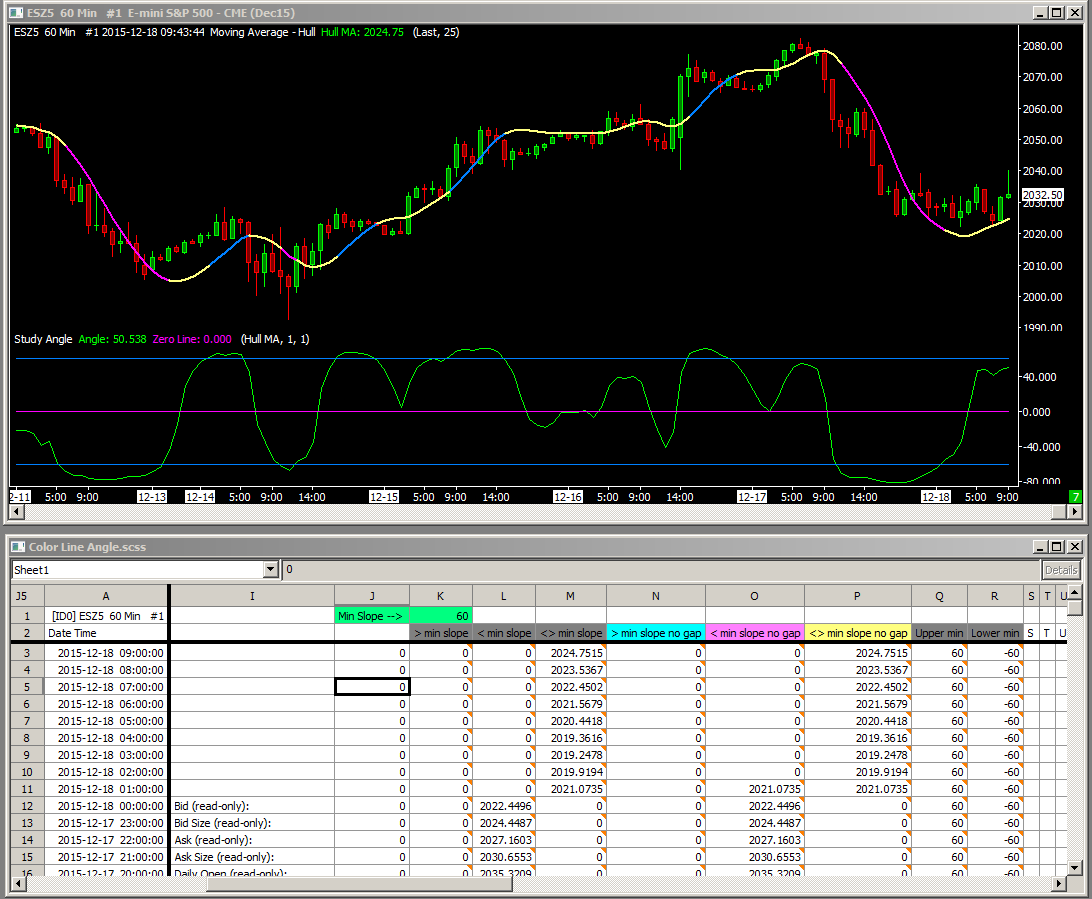
When coloring a Moving Average line based on conditions, the coloring can visually extend beyond the final bar where the condition is true. This is because the Line and Line - SkipZeros Draw Styles both want to 'connect' to the subsequent bar where the condition is no longer true. This chartbook and spreadsheet study is an example of how to overcome this with formulas in columns (subgraphs) in a certain order that overpaint the previous subgraph.
Click on each of these links to download: Color Line Angle.cht Color Line Angle.scss and put both files in your Sierra Chart \Data folder, then open the chartbook. This example chartbook and spreadsheet study colors the Moving Average based on its slope as determined by the Study Angle study. The user sets the minimum +/- angle in cell K1 that should differentially color the line, one color for upslope and one for downslope. A third color is used for when the slope is in between. Also, lines are drawn on the Study Angle study at the value of the +/- minimum slope that was set in K1 by using two instances of a 1-period simple MA based on two spreadsheet columns. This concept can be modified for other situations where coloring a line based on a formula needs to visually end at the last bar where the condition is true. |

