
SawtoothTrade
Extending the Swing High and Low until price intersection
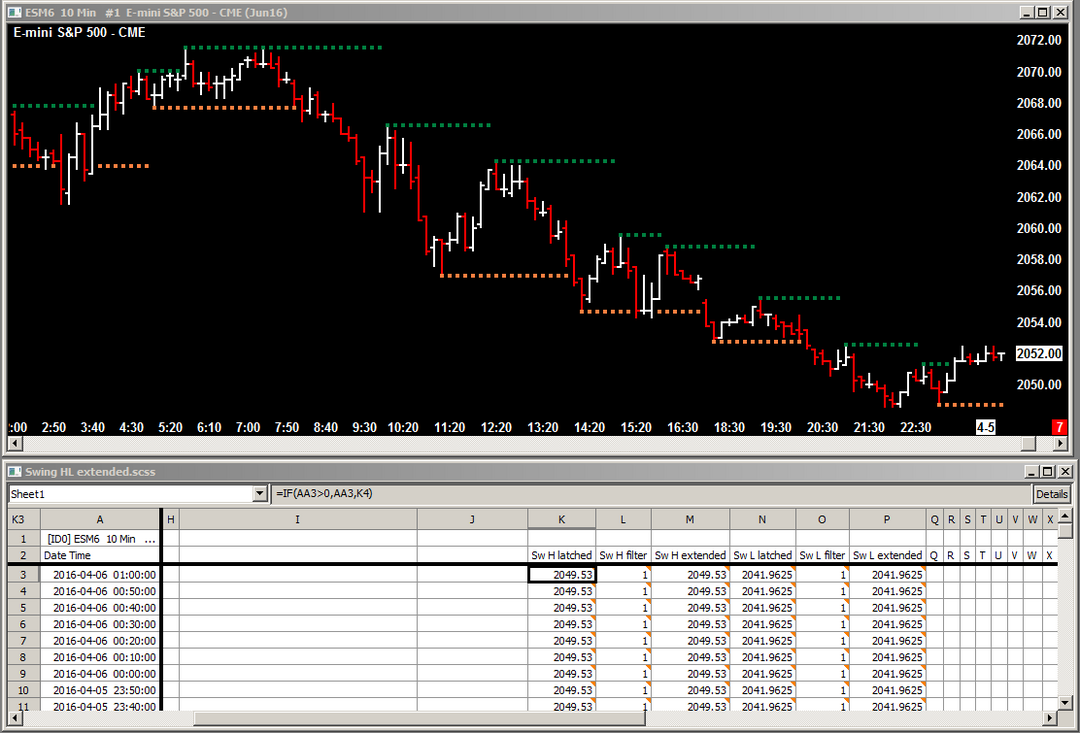
This chartbook and spreadsheet study takes the Swing High and Low values and creates a line extending them until price intersects it, or a new High or Low occurs.
Click on each of these links to download:
Swing HL Extended+.StdyCollct
Swing HL Extended.scss
and put both files in your Sierra Chart \Data folder.
The study collection will load the correct spreadsheet study with the correct settings, and it will add an instance of the Swing High And Low study. If you already have the Swing High And Low study added to your chart, you can remove the instance this study collection adds.
The formulas on the spreadsheet assume the Swing High And Low study appears in columns AA & AB. Move the Swing High And Low study to the top of the Studies to Graph list so that it outputs to these columns.