
SawtoothTrade
|
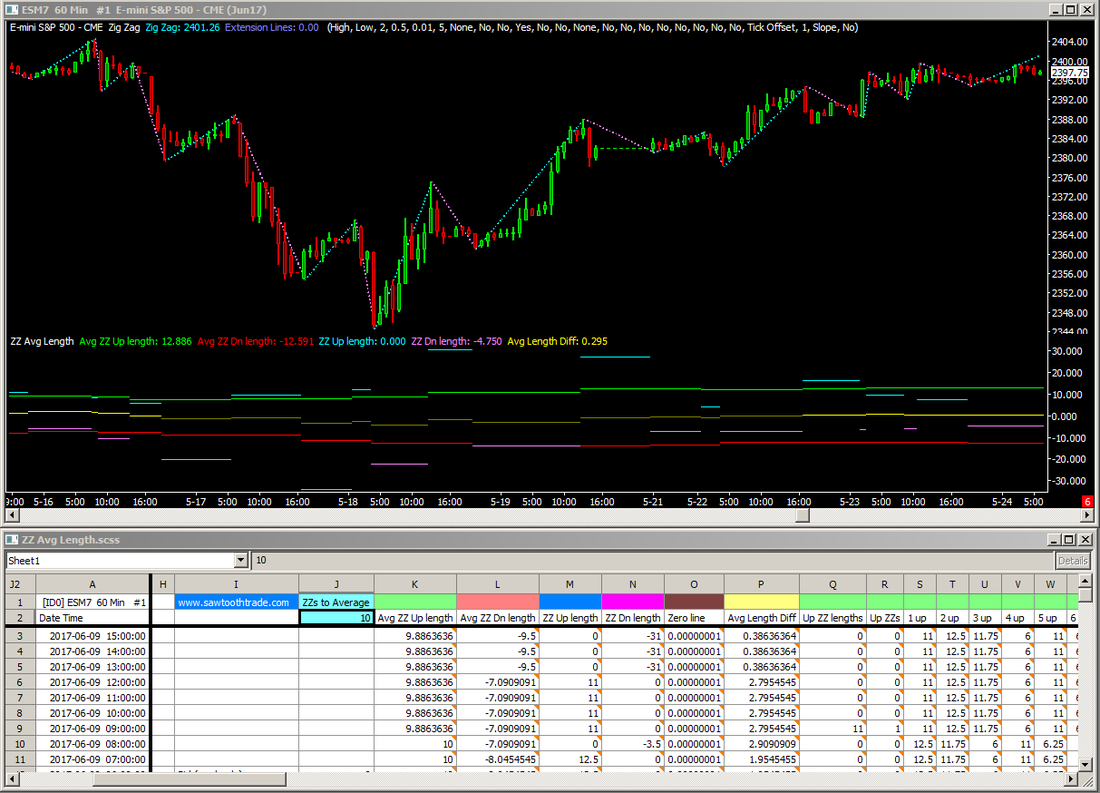
Zigzag Average Line Length
|
This spreadsheet study will calculate the average Zigzag line length, for up to 24 previous separate up and down legs. Use cell J2 to set the number of previous legs to average.
The green and red lines are the Zigzag average line lengths. The cyan and magenta dashes are the specific line lengths, displayed at the completion of the leg. Use these to compare to the averages. The yellow line is the difference between the up and down averages: -yellow and above zero if the up average is greater, -dark yellow and below zero if the down average is greater. This spreadsheet study requires that the 'Additional Output for Spreadsheets' is set to Yes in the Zigzag study settings. Click on each of these links to download: ZZ Avg Length+.StdyCollct ZZ Avg Length.scss and put both files in your Sierra Chart \Data folder. The study collection will load the correct spreadsheet study with the correct settings, and it will add an instance of the Zigzag study. The spreadsheet file contains the formulas; you must download both files. The formulas on the spreadsheet assume the Zigzag study appears in columns AA and above. Move Zigzag study to the top of the Studies to Graph list so that it outputs to these columns. |