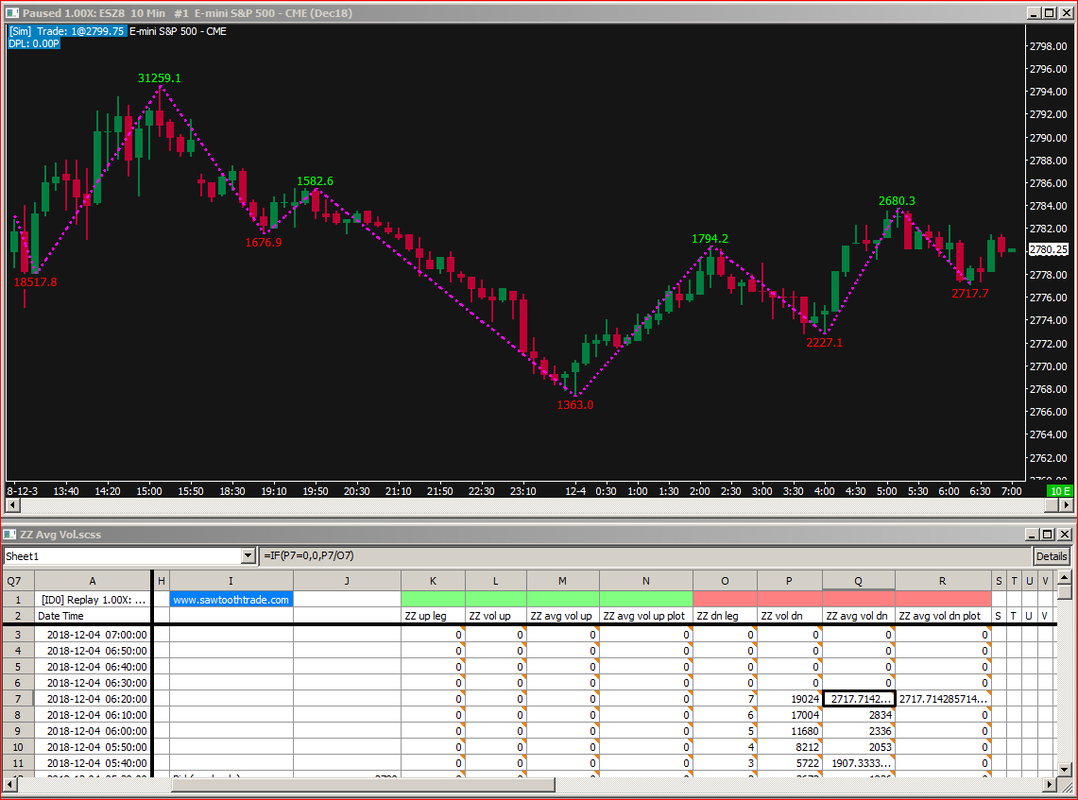
Zigzag Average Volume
|
This spreadsheet study will calculate the average volume of each Zigzag leg and display its value at each leg reversal.
The formulas count the bars from each Zigzag leg reversal then divide each leg's cumulative volume by the bar count then display only the latest value. Click on each of these links to download: ZZ Avg Vol.StdyCollct+ ZZ Avg Vol.scss and put both files in your Sierra Chart \Data folder. The study collection will load the correct spreadsheet study with the correct settings, and it will add an instance of the Zigzag study. The spreadsheet file contains the formulas; you must download both files. The formulas on the spreadsheet assume the Zigzag study appears in columns AA and above. Move Zigzag study to the top of the Studies to Graph list so that it outputs to these columns. |

