
SawtoothTrade
Composite Bar Underlay
Click on each link above to download.
Put both files in your Sierra Chart \Data folder, then click on Analysis >> Composite Bar Underlay+
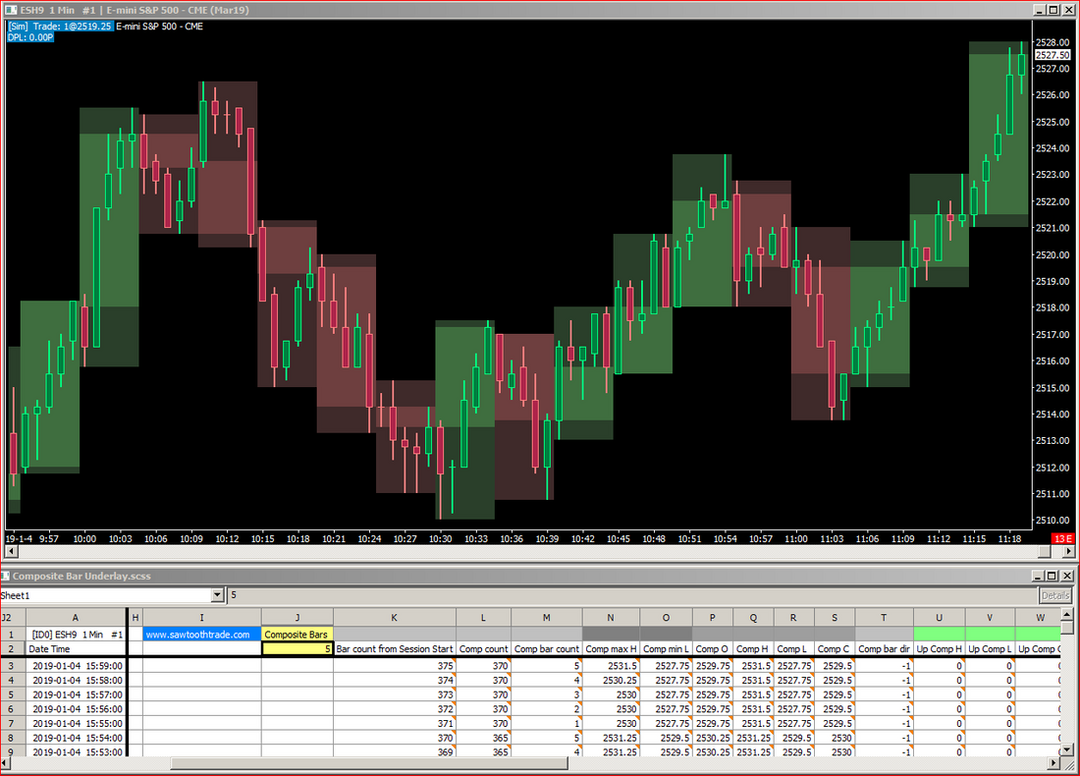
This spreadsheet study will plot a composite candle underneath n bars, combining the OHLC of those bars. Each composite bar is colored based on whether it closed up or down, allowing the user to determine its OHLC values.
This is a self-contained standalone study that does not reference any other study.
It will include n bars of all Intrabar bar types, except on most renko bars, in the underlaid bar. It does the same on Historical bars but the starting bar is random.
Note: The underlaid bar is not time based, so there is no comparison of time duration between the underlaid bar and the bars it contains, unless both are time based. Therefore, you could use the native Study/Price Overlay study to 'underlay' this study on a non-time-based chart.
The user can choose the number of bars to use to create the composite bar by a setting in cell J2 on the spreadsheet. The study uses the Chart Setting's Session Start Time as the first bar to use when building the composite bars.
The study collection will load the correct spreadsheet study with the correct settings. You must use the study collection to add this study to a chart.
The spreadsheet file contains the formulas; you must download both files.
This study was created on Chart 1. If you add this study to a chart other than Chart 1, you must copy/paste cells J1:J2 from Sheet1 to the Sheet# that corresponds to the Chart# where this study is added. You then must use the J2 setting on that new Sheet#.
In Chart Settings, I recommend setting ' Include Columns With No Data' to Yes.
6/21/2023 v1b Updated to accommodate Evening Session Times