SawtoothTrade
Moving Averages that reset at the first bar of a new day

Click on each link above to download.
Put both files in your Sierra Chart \Data folder, then click on Analysis >> SMAs EMAs at new day+
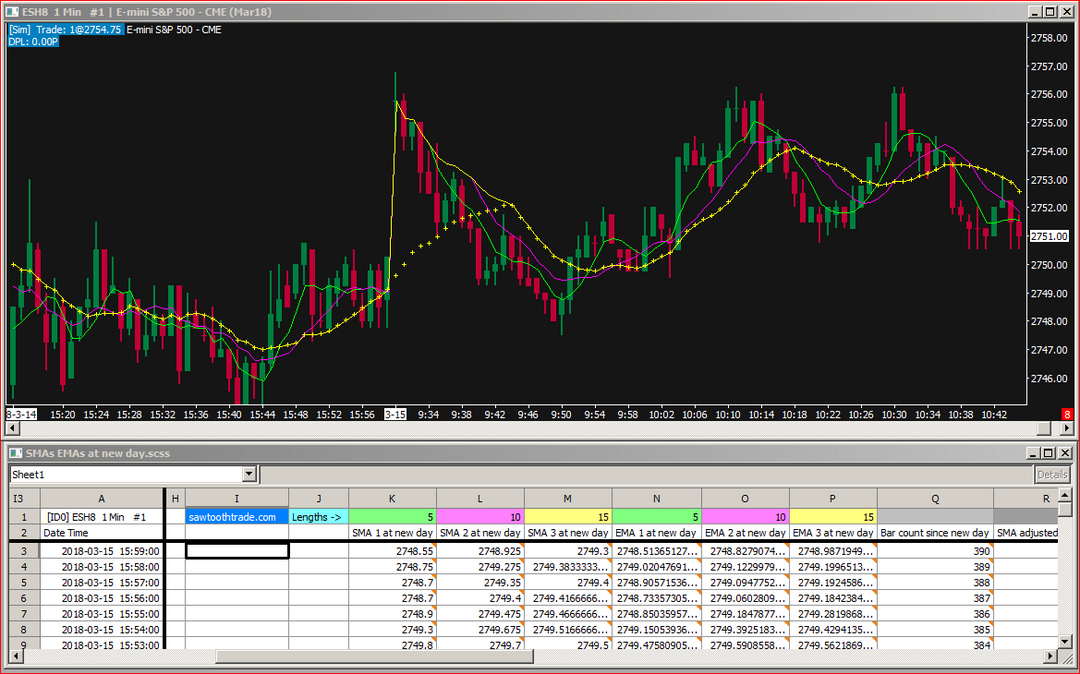
This spreadsheet study will calculate and plot up to three Simple Moving Averages and/or three Exponential Moving Averages that will start their averaging at the first bar of a new day, instead of including bars from the previous day.
This is a self-contained standalone study that does not reference any other study, and it works on all intraday bar types. It will not work on Historical charts.
The user sets the Length of each respective MA in row 1 on the spreadsheet. The study uses the date transition as the starting bar so it is assumed that the day's ending bar is not equal to or later than midnight.
The 15 bar SMA drawn with a plus symbol in the picture above is not from this spreadsheet study, and does not reset at the first bar of the day. It is meant to show the difference from the one that resets. Note that they converge at the 15th bar of the new day.
The study collection will load the correct spreadsheet study with the correct settings.
You must use the study collection to add this study to a chart.
The spreadsheet file contains the formulas; you must download both files.
This study was created on Chart 1. If you add this study to a chart other than Chart 1, you must copy/paste cells J1:P1 from Sheet1 to the Sheet# that corresponds to the Chart# where this study is added. You then must use these cells to set the MA lengths on that new Sheet#.