
SawtoothTrade
Defining Range / Implied Defining Range
Click on each link above to download.
Put both files in your Sierra Chart \Data folder.
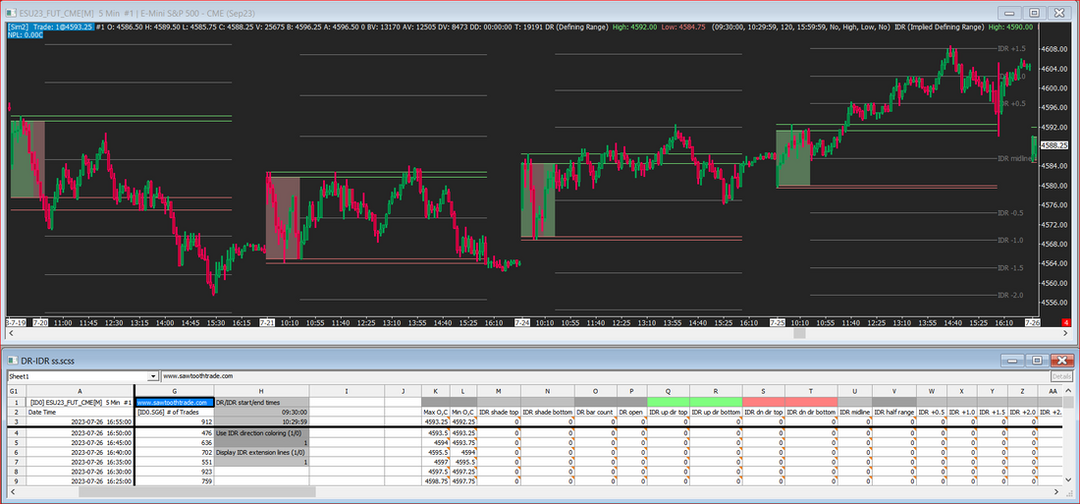
This chartbook and spreadsheet file will draw the Defining Range (DR) and the Implied Defining Range (IDR). It uses two instances of the High/Low For Time Period study as a basis, then the spreadsheet formulas calculate all of the other lines and shading.
These user options are on the spreadsheet in column H:
- DR start and end times.
These must match the times set in both High/Low For Time Period studies.
The times need to be the same in all 3 locations.
- Use IDR direction coloring.
When set to 0, the shading is gray.
When set to 1, the shading is based on the DR Open and Close.
- Display IDR extension lines.
When set to 0, there are no extension lines.
When set to 1, 20 extension lines are drawn, 10 above and 10 below.
- Display DR-IDR shading.
When set to 0, there is no shading between the DR-IDR extension lines.
When set to 1, shading occurs between the DR-IDR extension lines.
Note: When changing these settings, please do a Chart >> Recalculate.
You must download both files so that the spreadsheet study uses the correct settings.