
SawtoothTrade
|
Return the value at previous occurrences
|
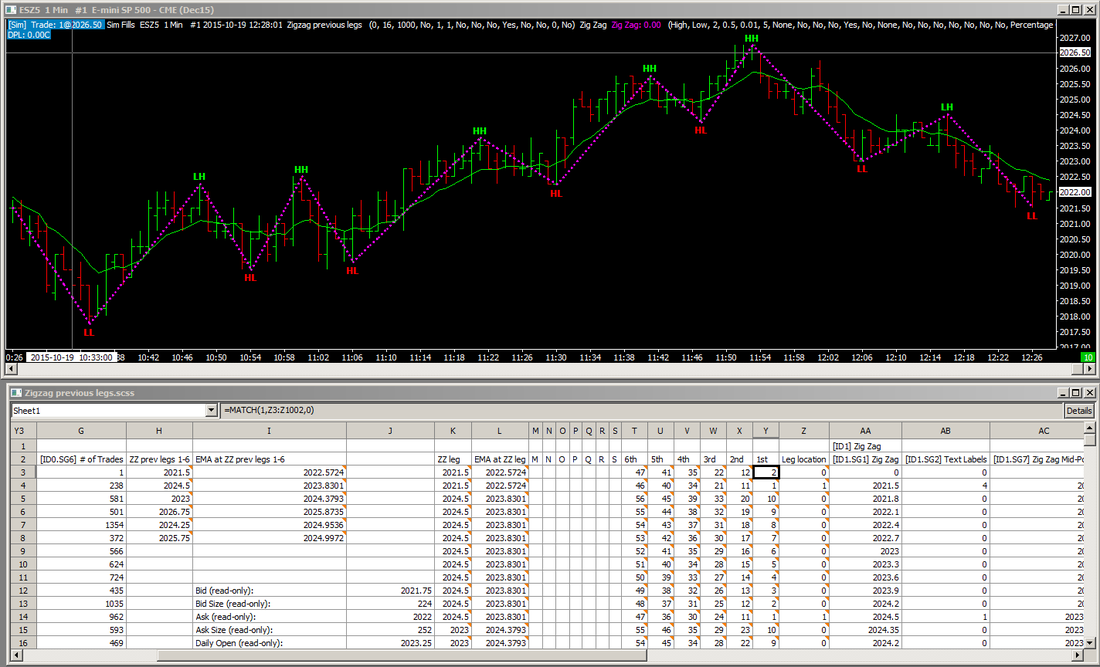
This chartbook/spreadsheet study will return the price of the previous 6 Zigzag legs, and the value of an EMA at the previous 6 Zigzag legs. The Zigzag study is used only as an example of a study that has irregular occurrences of a value change, but the concept could be applied to other studies. The spreadsheet formulas are mostly for example, since the study is not that useful for a single purpose.
Click on each of these links to download: Zigzag previous legs.cht Zigzag previous legs.scss and put both files in your Sierra Chart \Data folder, then open the chartbook. You may need to change the symbol to one your broker uses. On the spreadsheet: -Cells H3-H8 contain the price at the previous 6 Zigzag turns. -Cells I3-I8 contain the value of an EMA at the previous 6 Zigzag turns. This is just an example of what you might want to do. -Column K shows the price at the previous Zigzag turn. -Column L shows the value of an EMA at the previous Zigzag turn. -Column Z shows a 1 when the Zigzag turns, else 0. -Columns Y-T show the relative row of the previous respective Zigzag turns, as labeled in cells Y2-T2. |