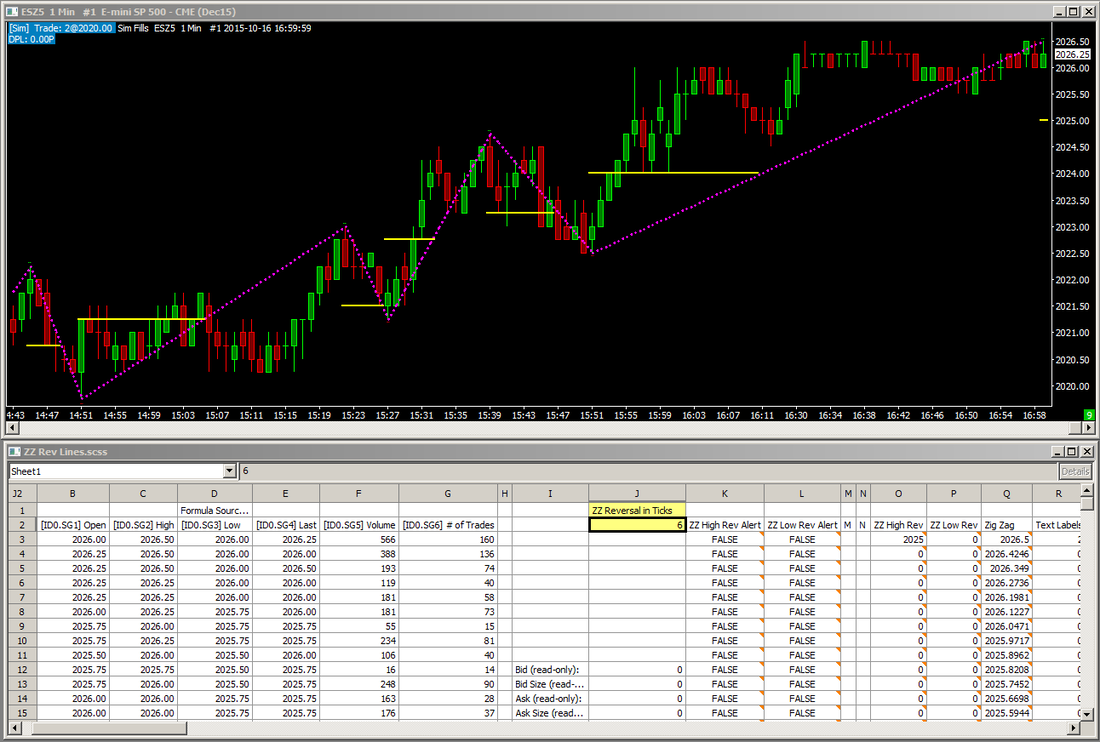
Zigzag reversal lines with alerts
|
This spreadsheet study will draw lines at the potential reversal level from the previous zigzag swing high/low, and an alert will sound when the current price crosses that line. This study only works with Zigzag Calculation Modes 2 & 3.
Click on each of these links to download: ZZ Rev Lines+.StdyCollct ZZ Rev Lines v1b.scss and put both files in your Sierra Chart \Data folder, then click on Analysis >> ZZ Rev Lines- The study collection will load the correct spreadsheet study with the correct settings, and it will add an instance of the Zig Zag study. If you already have the Zig Zag study added to your chart, you can remove the instance this study collection adds. The Zigzag reversal delta in ticks is set in cell J2, and must match the 'Reversal Amount for Calculation Modes 2,3' setting in the Zigzag study, which is in points. You'll need to convert the latter from points to ticks so that the reversal in J2 matches the reversal in the Zigzag study. The formulas on the spreadsheet assume the Zig Zag study appears in columns AA (Zigzag) and AB (Test Labels). Either move the Zig Zag study to the top of the Studies to Graph list, or edit the formulas in cells Q3 and R3 to reference the correct Zig Zag columns. This spreadsheet’s formulas are built on Sheet1, which corresponds to Chart #1. If you apply this study to a different chart number, you must copy the contents of cells J1&J2 on Sheet1 to cells J1&J2 of the corresponding Sheet#. |

