
SawtoothTrade
|
Clear Method Trend Line
|
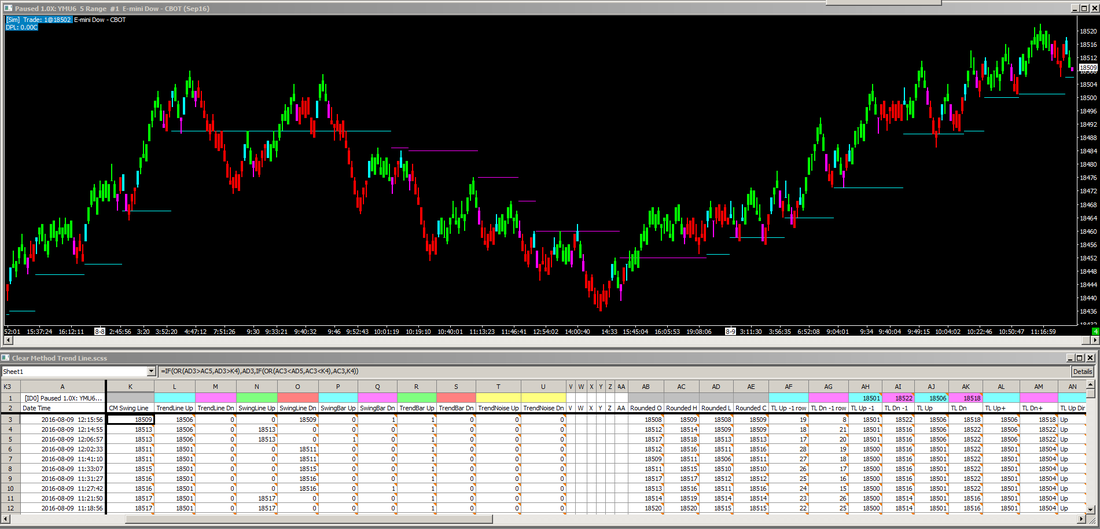
This study is based on Ron Black's Clear Method Swing Line indicator that identifies a change in trend when a price bar wholly exceeds the bar that made a swing high/low. The spreadsheet calculates when the price bar 'clears' a previous bar, then expands the concept to include a Trend Line that shows a broader trend. The Trend Line changes direction when it 'clears' the Trend Line of the opposite direction.
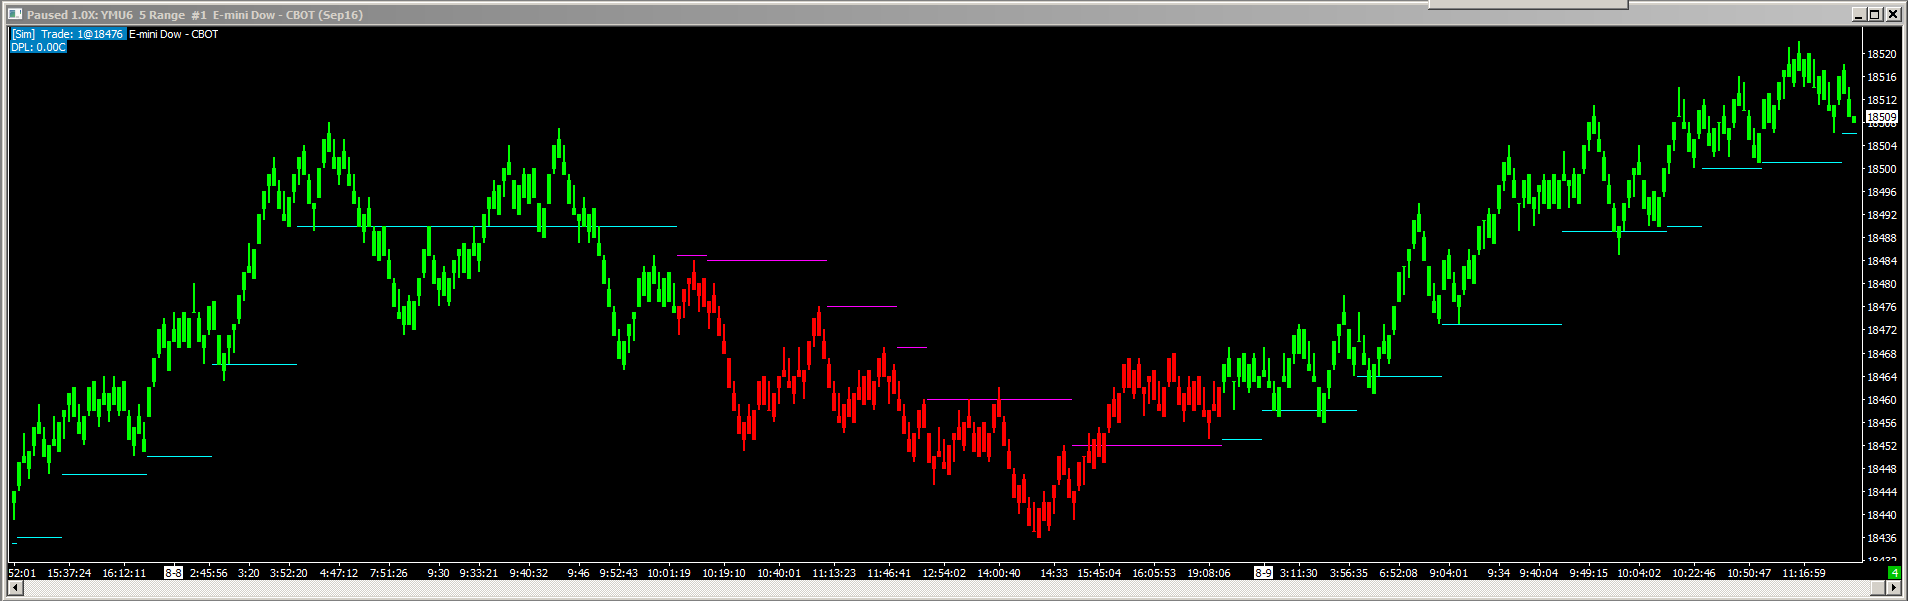
This study will color the following: 1) It colors the Swing Line price bars to match the Clear Method Swing Line direction/color. The Clear Method Swing Line is not drawn, but could be by setting the Draw Style of SG1 to Line. 2) It colors the Swing Bar price bars when the Swing Line trend change occurs. This is the first bar that is 'clear', and signals a Clear Method Swing Line direction change. 3) It draws a Trend Line at the swing high/low, beginning at the Swing Bar, and maintains its level, or another level in the same direction, until the Trend Line changes direction. 4) It will optionally color Trend Bar price bars to match the Trend Line direction. 5) It will optionally also color Trend Noise price bars that are on the opposite side of the Trend Line before it changes direction. This is used with 4) above. This is a standalone study that does not require any other studies. This study requires v1455 or later. Click on each of these links to download: Clear Method Trend Line+.StdyCollct Clear Method Trend Line.scss and put both files in your Sierra Chart \Data folder, then click on Analysis >> Clear Method Trend Line- |
|
To show the Trend Bar price bar colors, go to the Clear Method Trend Line spreadsheet study and set the Draw Style of SG8 and SG9 to Color Bar. (Analysis >> Studies >> choose Clear Method Trend Line>> Settings >> Subgraphs tab.)
|
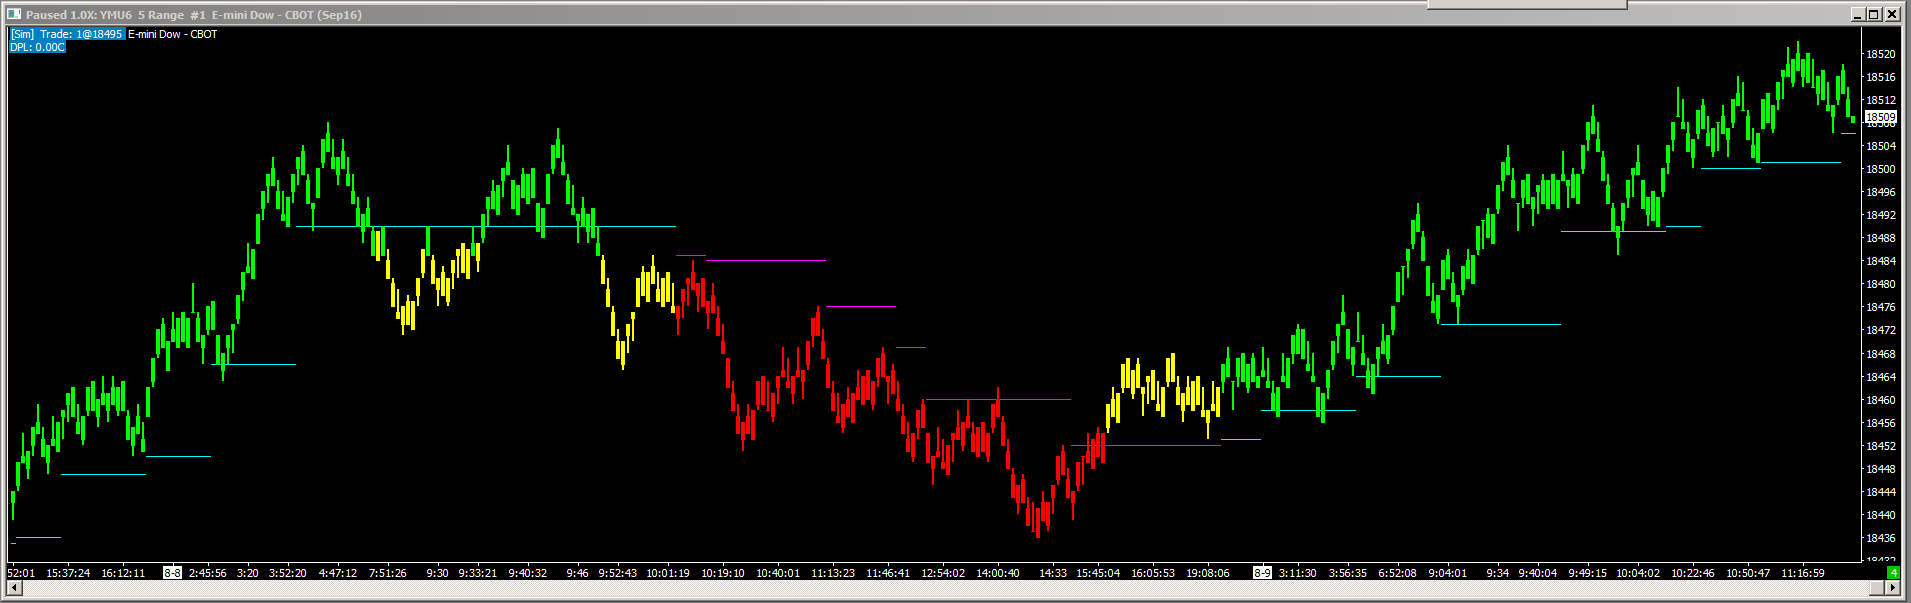
|
To also show the Trend Noise price bar colors, go to the Clear Method Trend Line spreadsheet study and set the Draw Style of SG10 and SG11 to Color Bar. (Analysis >> Studies >> choose Clear Method Trend Line >> Settings >> Subgraphs tab.)
If you do not see any Trend Lines, Trend Bars, or Trend Noise, go to Chart >> Chart Settings and either decrease the bar size/duration, or increase the Days to Display/Load. This study’s trend line formulas require additional bars to begin calculating. 1/16/2017 v1b fixed bug when tick size is greater than 1 9/10/2019 v1c modified formulas to improve performance 9/10/2019 v1d reduced file size to improve performance |